Software
As part of our work aimed at identifying signatures of perturbagen response, the HMS LINCS Center has developed a number of new methodologies for data collection and visualization and for multidimensional data analysis. Below is a summary table listing all publicly available tools, followed by detailed descriptions of key ongoing projects. The majority of these tools were developed by members of the Sorger Lab and the Laboratory of Systems Pharmacology (LSP) at HMS. Additional contributors and collaborators are listed in the individual descriptions of the tools.
Released Software
Data Annotation and Storage |
|
 HMS LINCS Database: Online database for HMS LINCS datasets and related experimental and reagent metadata. Developed by the ICCB-Longwood Screening Facility, the Sorger Lab, and the LSP at HMS. HMS LINCS Database: Online database for HMS LINCS datasets and related experimental and reagent metadata. Developed by the ICCB-Longwood Screening Facility, the Sorger Lab, and the LSP at HMS. |
hmslincs at GitHub |
| openmicroscopy at GitHub | |
Data Visualization and Analysis |
|
 Breast Cancer Browser: Online portal with custom, interactive visualizations of datasets of significant interest to researchers studying breast cancer biology, drug response, and drug polypharmacology. Developed by the Sorger Lab at HMS. Breast Cancer Browser: Online portal with custom, interactive visualizations of datasets of significant interest to researchers studying breast cancer biology, drug response, and drug polypharmacology. Developed by the Sorger Lab at HMS. |
cancerbrowser at GitHub |
 GR Browser: Online tool for calculating growth rate inhibition metrics and browsing LINCS dose-response datasets. Developed by the Sorger Lab at HMS and the LINCS DCIC group at University of Cincinnati led by Mario Medvedovic. GR Browser: Online tool for calculating growth rate inhibition metrics and browsing LINCS dose-response datasets. Developed by the Sorger Lab at HMS and the LINCS DCIC group at University of Cincinnati led by Mario Medvedovic. |
grcalculator at GitHub |
 Drug Response Browser 1: Interactive browser tool for exploring the responses of 53 cell lines to 62 anti-cancer drugs. Developed by the Sorger Lab at HMS. Drug Response Browser 1: Interactive browser tool for exploring the responses of 53 cell lines to 62 anti-cancer drugs. Developed by the Sorger Lab at HMS. |
hmslincs at GitHub |
 Drug Response Browser 2: Interactive browser tool for exploring the responses of 6 breast cancer cell lines to 107 anti-cancer drugs. Developed by the Sorger Lab at HMS. Drug Response Browser 2: Interactive browser tool for exploring the responses of 6 breast cancer cell lines to 107 anti-cancer drugs. Developed by the Sorger Lab at HMS. |
cancerbrowser at GitHub |
 RTK Profile Browser 1: Interactive browser tool for exploring the basal levels and activity of key receptor tyrosine kinases (RTKs) across a panel of 39 breast cancer cell lines. Developed by the Sorger Lab at HMS. RTK Profile Browser 1: Interactive browser tool for exploring the basal levels and activity of key receptor tyrosine kinases (RTKs) across a panel of 39 breast cancer cell lines. Developed by the Sorger Lab at HMS. |
hmslincs at GitHub |
 RTK Profile Browser 2: Interactive browser tool for exploring the basal levels and activity of key receptor tyrosine kinases (RTKs) across a panel of 39 breast cancer cell lines. Developed by the Sorger Lab at HMS. RTK Profile Browser 2: Interactive browser tool for exploring the basal levels and activity of key receptor tyrosine kinases (RTKs) across a panel of 39 breast cancer cell lines. Developed by the Sorger Lab at HMS. |
cancerbrowser at GitHub |
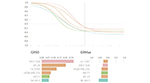
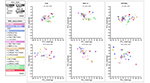
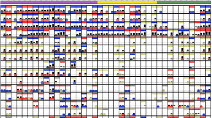 GF Response Browser 1: Comprehensive analysis matrix showing ERK and Akt responses to growth factor stimulation. Developed by the Sorger Lab and the LSP at HMS. GF Response Browser 1: Comprehensive analysis matrix showing ERK and Akt responses to growth factor stimulation. Developed by the Sorger Lab and the LSP at HMS. |
hmslincs at GitHub |
 GF Response Browser 2: Interactive browser tool for exploring ERK and Akt responses to growth factor stimulation in breast cancer cells. Developed by the Sorger Lab and the LSP at HMS. GF Response Browser 2: Interactive browser tool for exploring ERK and Akt responses to growth factor stimulation in breast cancer cells. Developed by the Sorger Lab and the LSP at HMS. |
cancerbrowser at GitHub |
 Adaption Browser 1: Interactive browser tool to interrogate the molecular pathways impinging upon drug-induced adaptive responses in BRAF(V600E) melanoma cell lines. Developed by the Sorger Lab and the LSP at HMS. Adaption Browser 1: Interactive browser tool to interrogate the molecular pathways impinging upon drug-induced adaptive responses in BRAF(V600E) melanoma cell lines. Developed by the Sorger Lab and the LSP at HMS. |
hmslincs at GitHub |
 Adaption Browser 2: Interactive browser tool to interrogate the molecular pathways impinging upon drug-induced adaptive responses in BRAF(V600E) melanoma cell lines. Developed by the Sorger Lab and the LSP at HMS. Adaption Browser 2: Interactive browser tool to interrogate the molecular pathways impinging upon drug-induced adaptive responses in BRAF(V600E) melanoma cell lines. Developed by the Sorger Lab and the LSP at HMS. |
hmslincs at GitHub |
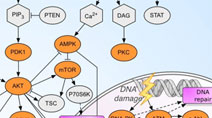 Drug-Pathway Browser: Interactive map of key signal transduction pathways and relevant drug-target data. Developed by the Sorger Lab at HMS. Drug-Pathway Browser: Interactive map of key signal transduction pathways and relevant drug-target data. Developed by the Sorger Lab at HMS. |
hmslincs at GitHub |
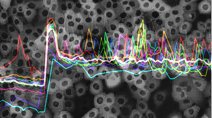 Live-cell Dynamics Browser: Online live-cell data visualization showing the responses of single cells to treatment with 3 EGFR/Her2 inhibitors. Developed by the Sorger Lab and the LSP at HMS. Live-cell Dynamics Browser: Online live-cell data visualization showing the responses of single cells to treatment with 3 EGFR/Her2 inhibitors. Developed by the Sorger Lab and the LSP at HMS. |
hmslincs at GitHub |
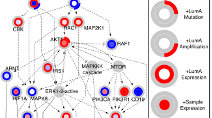 TieDIE: Computational tool connecting genomic perturbations to gene expression changes characteristic of cancer subtypes. Developed by the Stuart lab at UCSC in collaboration with the Sorger Lab at HMS. TieDIE: Computational tool connecting genomic perturbations to gene expression changes characteristic of cancer subtypes. Developed by the Stuart lab at UCSC in collaboration with the Sorger Lab at HMS. |
tiedie at GitHub |
 LINCS Canvas Browser: Interactive web app to query, browse, and interrogate LINCS L1000 gene expression signatures. Developed by the Ma’ayan lab in collaboration with the Sorger Lab at HMS. LINCS Canvas Browser: Interactive web app to query, browse, and interrogate LINCS L1000 gene expression signatures. Developed by the Ma’ayan lab in collaboration with the Sorger Lab at HMS. |
online app |
Ongoing Software Development Projects
HMS LINCS Database
The HMS LINCS Database is under continuous development by the software development teams in the ICCB-Longwood Screening Facility, the Sorger Lab, and the LSP at HMS. The Database is a public resource for browsing, searching, and downloading HMS LINCS data. The web standards-based API (application programming interface) can be used to query and access each of the data types managed by the database, including compound information, library descriptions, and datasets. Please refer to the HMS LINCS Database URL scheme and programmatic access guide for more information.
For small molecule compounds stored in the HMS LINCS Database, the system stores common names, chemical structure and properties, relevant publications, and links to other public resources, such as PubChem and ChEMBL, which contain additional information about each compound. As batches of compounds are received for screening at HMS, information about each batch is recorded, such as vendor/source information and quality control documents.
For experiments performed at HMS, the Database stores the layout and concentrations of compounds and other reagents across the wells of assay microplates, as well as information about experimental protocols, controls, and data analysis methods. Raw experimental data and analyzed results are all stored in the system and may be browsed or downloaded for further review and analysis. HMS LINCS experimental datasets are often multi-dimensional, resulting from several different assays run in parallel that monitor the effects of different compounds tested at multiple concentrations on different cell lines and read out at multiple time points.
Compound profiling data provided by third parties, such as KINOMEscan (DiscoveRx) and KiNativ data, are imported and associated with the relevant compounds described in the Database. This allows profiling data to be viewed alongside detailed reagent information for each screened compound and also downloaded by Database users.
- Browse the HMS LINCS Database
- View the HMS LINCS Database URL scheme and programmatic access guide
- Get involved with the HMS LINCS Database project at GitHub
OMERO
Because live- and fixed-cell imaging constitute important types of data for HMS LINCS, we have deployed the OMERO server software from the Open Microscopy Environment project to manage these data. OMERO is under continuous development by the OME Consortium, and the Sorger Lab and the LSP at HMS regularly contribute to the design and development of custom tools for high-throughput data annotation and presentation.
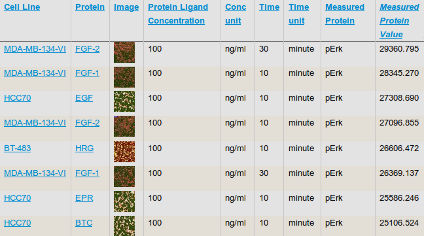
OMERO provides web-based viewing and downloads in a variety of formats including OME-TIFF as well as a programmatic interface (API) for integration with other systems such as the HMS LINCS Database. For example, see HMS Dataset 20003 (Tang Mitosis/Apoptosis) in the HMS LINCS Database, which integrates OMERO images (see the “Image” column) with the numerical assay results.