Signatures & Networks
Two of the ways in which we aim to interpret LINCS data are through the creation of signatures and networks.
Signatures
By signatures of perturbagen response (which we also call pharmaco-response signatures) we mean a set of reduced-dimensionality descriptors of the underlying data that capture key aspects of biological activity, provide insight into mechanism, and serve as predictors. IC50 is a traditional signature in pharmacology; a transcript signature of gene activity is a more modern example. To develop meaningful signatures, data from diverse assays must be scaled and normalized. Normalization and scaling of heterogeneous, multi-parameter dose-response data is a non-trivial task involving conceptual and practical hurdles. We need to translate a very diverse set of measurements into comparable units. Initially, we combine data into simple sets of biologically informative parameters, such as the fraction of cells in G0, mitosis, apoptosis, etc. to reduce their dimensionality. We will also explore more complex methods that explicitly take cellular heterogeneity into account.
Networks
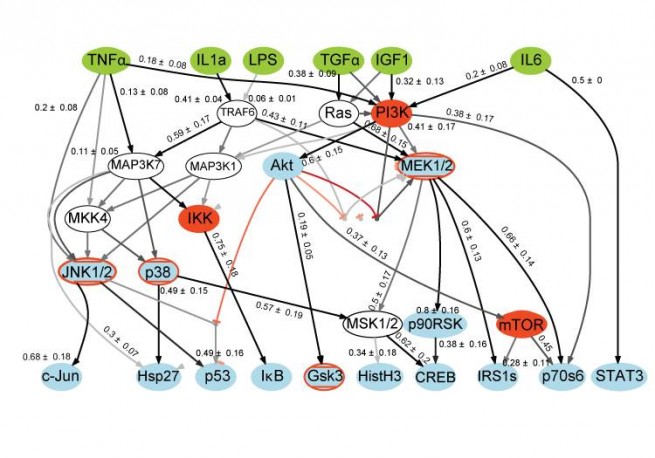
Networks are node-edge graphs that depict interactions among biomolecules under a particular condition or at a specific point in time. They are a relatively simple representation of biochemical relationships.
One of the ways in which we are creating networks from LINCS data is by combining information on cellular responses with network inference techniques. Previously we have shown that regression methods (Alexopoulos et al. 2010 doi:10.1074/mcp.M110.000406), Boolean logic (Saez-Rodriguez et al. 2009, doi:10.1038/msb.2009.87), and “constrained fuzzy logic” (cFL; Morris et al. 2011, doi:10.1371/journal.pcbi.1001099) can be used to infer the connectivity and logic of signal transduction networks from cue-signal-response data. We are also exploring methods based on Bayesian inference and mutual information. Typically we start with a prior knowledge network (PKN) that represents the state of knowledge about a network in the literature as represented in an interactome (a node-edge graph). We then compute all models compatible with this topology and compare them to data, thereby creating a “calibrated” model that can predict the results of exposing cells to new combinations of perturbations. One thing we have demonstrated is that the great majority of interactions in large-scale networks do not appear to be active in any single cell line and that cell lines differ substantially from each other. This has allowed us to map signaling topology onto measures of oncogenic transformation.
However, our efforts at network inference do not yet take advantage of the breadth of data we are collecting in the LINCS project, and the computational methods are in their infancy. To date, models have been based on relatively few cell lines and perturbations, and we are only beginning to correctly account for small molecule polypharmacology. We also have just started connecting biochemical data on immediate-early signaling to transcriptional responses. We will continue to pursue internal modeling efforts even as we look to users of LINCS data to bring innovative new approaches to network analysis.
