Assays
A distinguishing feature of the HMS LINCS Center is its use of a wide range of measurement technologies including direct assays of drug-kinase interaction in cell extracts, multiplex biochemical assays of cell signaling proteins, imaging assays, assays of transcriptional response (in collaboration with the Broad LINCS Center), and assays of cell viability. Although the individual assays used in the HMS LINCS Center are quite common in conventional cell-biological studies, our goal is to collect ‘systematic’ data sets in which the assays are performed in a quantitative and reproducible way on many samples with many perturbing small molecules (or other perturbagens) applied at multiple doses and in many cell lines. HMS LINCS assays continue to evolve and improve over time. Because most HMS LINCS projects use multiple types of assays, we provide information on specific assay protocols with each dataset in the HMS LINCS Database.
As explained in the description of the HMS LINCS approach, it is not possible to collect all types of data for all perturbations and cell lines; instead we follow an adaptive data collection strategy in which exploratory studies are used to focus subsequent experiments on areas of the cell-perturbation-measurement space in which we believe informative signatures can be identified.
HMS LINCS assays and dataset types
1. KINOMEscan and KiNativ assays measure interactions of kinase inhibitors with kinases
HMS LINCS collects drug-target interaction data on the binding of small molecule drugs to recombinant kinases (KINOMEscan assays) or to kinases present in cell extracts (KiNativ assays and other mass-spec assays). Even clinical-grade small molecule kinase inhibitors are not mono-specific, and kinases having similar ATP binding pockets often exhibit drug cross-reactivity, even if the kinases have very different biological roles.To better understand which proteins are bound by kinase inhibitors, we are creating a set of profiles based on experiments performed in vitro using commercially available methods that are in widespread use in industry. We are also developing new mass spec methods in house to monitor kinase inhibitor binding to kinases in cell extracts: see McAllister, F. E. et al. Mass Spectrometry Based Method to Increase Throughput for Kinome Analyses Using ATP Probes. Anal. Chem. 85, 4666–4674 (2013). doi:10.1021/ac303478g PMID:23607489. The commercial profiling methods we are employing include the KINOMEscan assay from DiscoveRx and the KiNativ assay from ActivX. KINOMEscan measures drug binding using a panel of over 400 purified kinases. KiNativ assays measure the competition of an inhibitor for the ATP-binding pocket of kinases in cell lysates. KINOMEscan and KiNativ assay data on HMS LINCS compounds, and more details about the assay protocols, can be found in the HMS LINCS Database. Looking forward, biochemical profiling of inhibitors in house will allow for more in-depth analysis of drug interactions in multiple cell types.
2. Biochemical responses
Biochemical response data on the abundance and state of modification of 20-100 signaling proteins are captured using microplate-based ELISA assays, bead-based ELISA (xMAP and Luminex) assays, Western blotting, and reverse phase lysate arrays (RPLAs).

Reverse phase lysate microarray technology (Wolf-Yadlin et al. (2009) doi 10.1016/j.cbpa.2009.06.027). A: Experimental design. Cells are grown in 96-well plates and treated with perturbagens. Each well is then lysed to generate ~30 uL of cleared lysate that is spotted onto duplicate nitrocellulose-coated slides, creating multiple copies of the array. Each array is probed with one or two antibodies with fluorescent readout. B: Example data. In this experiment cells were serum starved and then treated with one concentration of one small molecule drug (from a library of 84) plus EGF. Lysates were prepared 1 hr later and probed with validated antibodies to phosphoepitopes in the EGF pathway. Red shows the degree of inhibition (loss of signal normalized to no-drug control); green shows the degree of stimulation.
3. Microscopy and imaging assays
In microscopy and imaging assays, cells are are treated with perturbagens and then fixed and stained with fluorescent dyes and/or immunostained in order to monitor various cell properties (shape, size, nuclear area) or protein levels. This allows measurement of protein modification state and cellular localization as well as scoring of cell cycle state, cell growth rate, or apoptotic state over time. We collect both fixed and live-cell imaging data on responses to perturbagens. Live-cell assays involve either white light or fluorescent reporter protein microscopy. Fixed-cell imaging involves the use of dyes, stains, reporter proteins, and immunofluorescence. Many HMS LINCS fixed-cell assays are analyzed using ImageRail software.

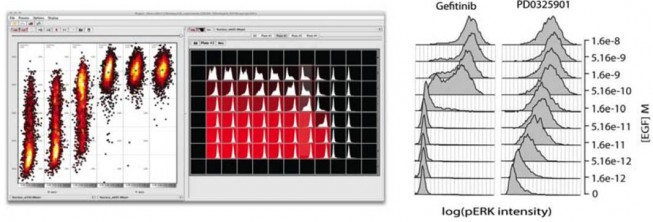
Responses of SkBR3 breast cancer cells to the ErbB1 inhibitor gefitinib or the Mek inhibitor PD0325901 in the presence of varying concentrations of EGF. Measurements were performed using immunofluorescence of anti-phospho-Erk antibodies. The left-hand panel is a screen shot from ImageRail, software we developed for high-throughput analysis of cells in 96 and 384 well plates. The scatter plots show data from six wells, with each point representing a single cell. Also shown are the histograms of data from 1000 cells in 60 different wells.