Publication Summary
Metrics other than potency reveal systematic variation in responses to cancer drugs
Mohammad Fallahi-Sichani1, Saman Honarnejad1, Laura M. Heiser2, Joe W. Gray2, and Peter K. Sorger1
1 HMS LINCS Center, Harvard Medical School, Boston, MA; 2 Department of Biomedical Engineering, Oregon Health and Science University, Portland, OR
Nat Chem Biol (2013) 9, 708–714.
doi:10.1038/nchembio.1337 / PMID:24013279 / PMCID:PMC3947796
Synopsis
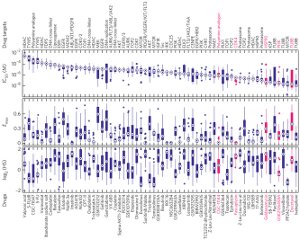
IC50 values are widely used measures of compound potency. A multi-parametric analysis of dose-response curves derived from a panel of breast cancer cell lines treated with anti-cancer drugs reveals that there can be systematic variability in dose-response parameters across drug classes and cell types, effects that are not apparent by inspection of IC50 values.
Key findings
- A multi-parametric analysis on dose-response data from 64 anti-cancer drugs in 53 breast cancer cell lines and on other cancer cell line data showed that dose-response parameters vary in a systematic way depending on cell proliferation rates and drug classes. Compound mechanism of action strongly influences these parameters.
- Cell doubling times correlated with potency and maximal effect for drugs that have cytotoxicity especially potentiated by cell cycling (for example, mitotic poisons and topoisomerase inhibitors).
- Drug maximal effect was consistently high for HDAC and DNA cross-linkers, whereas mTOR inhibition yielded curves shallower than expected (Emax and Hill slope < 1).
- Cell-to-cell variability in target modulation influenced the shape of the dose-response curve averaged for a cell population; subpopulations of cells unaffected at high drug doses create shallow curves.
Abstract
Large-scale analysis of cellular response to anti-cancer drugs typically focuses on variation in potency (IC50) assuming that it is the most important difference between effective/ineffective drugs or sensitive/resistant cells. We took a multi-parametric approach to analyzing a large set of dose response curves generated in the Gray Lab and reported originally in Heiser et al. with additional help from Nick Wang. Our approach involved analysis of the slope of the dose-response curve (HS), the area under the curve (AUC) and the maximum effect (Emax). We found that some of these parameters vary systematically with cell line and others with drug class. For cell-cycle inhibitors, Emax often but not always correlated with cell proliferation rate. For drugs targeting the Akt/PI3K/mTOR pathway dose-response curves were unusually shallow. Classical pharmacology has no ready explanation for this phenomenon but single-cell analysis showed that it correlated with significant and heritable cell-to-cell variability in the extent of target inhibition. We conclude that parameters other than potency should be considered in the comparative analysis of drug response, particularly at clinically relevant concentrations near and above IC50.
Explore the data
We encourage readers to explore the findings and the data underlying this study through the associated project exploration website, which presents the data through several customized data browsers. Through the links below, readers also can access the original datasets containing raw images and calculated metrics for the underlying dose-response analysis, as well as the software for the interactive data browsers developed for visualizing these data.
Available data and software
| Data | All raw imaging data and calculated fluorescence intensities across dose for 6 drugs in 4 breast cell lines at 2 timepoints (HMS Dataset #20136). | Details | Download (.xlsx) |
| Signatures | The results of multi-parametric analysis of dose-response data for 2789 drug-cell line combinations (HMS Dataset #20120). | Details | Download (.xlsx) |
| Software | A link to our HMS LINCS GitHub for access to the code underlying the interactive data browsers available on the associated project exploration website. | hmslincs at GitHub |
Funding sources
NIH LINCS grant U54 HG006097 to PKS; Stand Up to Cancer grant AACR-SU2C-DT0409 to PKS and JWG; and a Merck Fellowship of the Life Sciences Research Foundation to MF-S.
