Publication Summary
A dynamic view of the proteomic landscape during differentiation of ReNcell VM cells, an immortalized human neural progenitor line
Yuyu Song 1,2*, Kartik Subramanian 1*, Matthew J. Berberich 1*, Steven Rodriguez 1,4, Isabel J. Latorre 1, Catherine M. Luria 1, Robert Everley 1,3, Mark W. Albers 1,4, Timothy J. Mitchison 1,2 and Peter K Sorger1
*These authors contributed equally to this work.
1Laboratory of Systems Pharmacology, Program in Therapeutic Science, Harvard Medical School, Boston, MA 02115, USA.
2Department of Systems Biology, Harvard Medical School, Boston, Massachusetts 02115, USA.
3Department of Cell Biology, Harvard Medical School, Boston, Massachusetts 02115, USA.
4Department of Neurology, Massachusetts General Hospital, Boston, Massachusetts 02114, USA.
Scientific Data (2019) 6:190016
doi:10.1038/sdata.2019.16
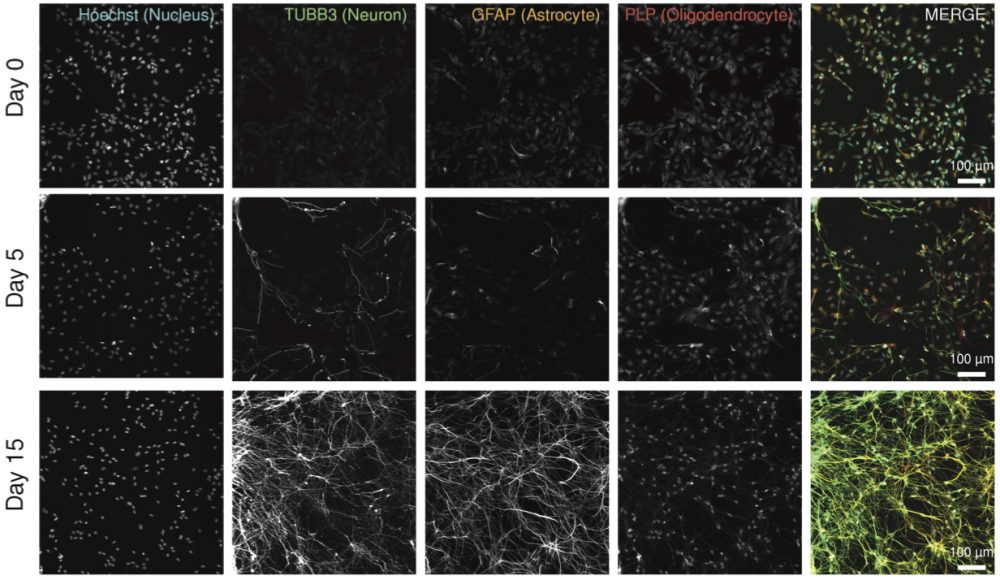
Figure 6a. Validation of neuronal/glial differentiation by immunofluorescent imaging (IF). ReNcell VM cells differentiate into neurons expressing TUBB3, astrocytes expressing GFAP, and oligodendrocytes expressing PLP1.
Synopsis
The differentiation of neural stem cells into fully functional neurons and glia requires precise regulation of diverse molecular pathways over time and space. We used mass spectrometry-based proteomics and phospho-proteomics to assess changes during ReNcell VM differentiation, both under basal conditions and after treatment with two small molecule perturbagens. In parallel, time lapse and immunofluorescent microscopy characterized phenotypical development, providing a powerful way to correlate molecular pathways with key morphological features and developmental markers.
Key Findings
- ReNcell VM cultures, which can be induced to differentiate by growth factor withdrawal generating a mixture of neurons and glia able to form functional electrophysiological circuits, are a valuable tool for studying the differentiation of neural progenitors.
- Proteomic, phospho-proteomic and high-content imaging assays revealed reproducible changes in the cytoskeleton, cell phase transitions, neuronal migration, glial differentiation, neurotrophic signalling and extracellular matrix regulation over the course of ReNcell VM differentiation.
- Differentiation accelerates in cultures treated with the small molecule perturbagens kenpaullone, a poly-selective CDK and GSK3 inhibitor, and mevastatin, a HMG-CoA reductase inhibitor.
Abstract
The immortalized human ReNcell VM cell line represents a reproducible and easy-to-propagate cell culture system for studying the differentiation of neural progenitors. To better characterize the starting line and its differentiation, we assessed protein and phospho-protein levels and cell morphology over a two-week period during which ReN cells differentiated into neurons, astrocytes, and oligodendrocytes. Five of the datasets measured protein levels or states of phosphorylation based on tandem-mass-tag (TMT) mass spectrometry and four datasets characterized cellular phenotypes using high-content microscopy. Proteomic analysis revealed reproducible changes in pathways responsible for cytoskeletal rearrangement, cell phase transitions, neuronal migration, glial differentiation, neurotrophic signalling and extracellular matrix regulation. Proteomic and imaging data revealed accelerated differentiation in cells treated with the poly-selective CDK and GSK3 inhibitor kenpaullone or the HMG-CoA reductase inhibitor mevastatin, both of which have previously been reported to promote neural differentiation. These data provide in-depth information on the ReNcell progenitor state and on neural differentiation in the presence and absence of drugs, setting the stage for functional studies.
Datasets and Associated Metadata and Code
This paper describes nine datasets of two different types: (i) TMT LC-MS of total protein or phosphopeptides acquired at ten time points over a 15-day period following differentiation of ReNcell VM, and (ii) images of cells undergoing the same differentiation process and acquired using either live-cell or immunofluorescence microscopy with the antibodies listed in Table 9. All data, metadata, and protocols are publicly available for download via Sage Bionetworks Synapse. Proteomics and phospho-proteomics datasets are also available through the HMS LINCS center database.
Baseline proteomics (Fig. 2, Table 2) and phospho-proteomics (Fig. 3, Table 3) data comprises TMT LC-MS data on protein abundance over the course of ReNcell VM differentiation; biological replicates were analysed for each time point (Table 2 and 3). Proteomics/phospho-proteomics data is reported as the number of peptides quantified in both replicates, and as normalized, scaled and summed TMT signal/noise values. Proteins/phospho-proteins were grouped into several K-means clusters as indicated in Table 2/3 (see column named “kmeans_cluster_name”) and shown in Figure 2C/3C.
Drug perturbation datasets (Fig. 4, Tables 4-6) report TMT LC-MS data at ten timepoints for cells treated with small molecule drugs previously reported to impact ReNcell VM differentiation. These include 2 µM kenpaullone (Table 4), 2 µM mevastatin (Table 5) or a DMSO-only control (Table 6). Data are reported in Tables 4-6 as number of peptides quantified in singlicate, and as normalized, scaled, summed TMT signal/noise values.
Microscopy datasets (Fig. 5) comprise representative imaging data collected in triplicate at 3-hour intervals over 15 days of ReNcell VM differentiation. For each condition, one .mp4 movie and 121.tiff files derived from the live-cell data were recorded. Immunofluorescence imaging of cell markers is presented in Fig. 6-9. Fig. 10 represents cells treaded with a DMSO vehicle-only control, cells treated with 2 µM kenpaullone and cells treated with 2 µM mevastatin.
Principal component analyses, hierarchical and K-means clustering, differential expression, and enrichment analyses were performed using customized code written in python (https://github.com/datarail/msda). The neuronal gene set library (syn12578559) was customized and downloaded from GSEA by searching for terms across all libraries that contained “neuron” in their name. All code that takes the datasets from Synapse, computes and plots the results shown in Figures 2-5 are available at https://github.com/sorgerlab/rencell.
| Manuscript Item | Associated Dataset | Synapse ID | HMS LINCS Dataset ID |
|---|---|---|---|
| Table 1 | Experimental metadata | syn11701218 | |
| Table 2 & Figure 2 | Proteomic profiling of whole cell lysate – no drug added (10 times points in dulicate x ~8,000 proteins detected) | syn11701290 | 20345 |
| Table 3 & Figure 3 | Phospho-proteomic profiling of affinity purified peptides (10 times points in dulicate x ~6,000 phospho peptides) | syn11701291 | 20346 |
| Table 4 & Figure 4 | Proteomic profiling of whole cell lysate with 2μm kenpaullone (10 times points x ~8,000 proteins detected) | syn11701292 | 20347 |
| Table 5 & Figure 4 | Proteomic profiling of whole cell lysate with 2μm mevastatin (10 times points x ~8,000 proteins detected) | syn11701293 | 20347 |
| Table 6 & Figure 4 | Proteomic profiling of whole cell lysate with DMSO vehicle control (10 times points x ~8,000 proteins detected) | syn11701294 | 20347 |
| Table 7 & Figure 5 | Fixed cell imaging data to determine reproducibility of differentiation time course (Differentiation timecourse by cell confluence in five passage numbers. Day 0 to day 15 (images acquired every 3 hours); 4 replicates per condition; 120 images per condition.) | syn11725079 | |
| Table 8 | Mass spectrometry 10-plex tandem mass tag look-up table | syn11701215 | |
| Table 9 | Immunofluorescent microscopy antibody look-up table | syn11701219 | |
| Figure 6 | Fixed cell imaging data to identify cell types (Day 0 – progenitor cells; Day 5 – differentiating cells; and Day 15 – fully differentiated cells. Replicate four-color immunofluorescence images for Hoechst (DNA),TUBB3, GFAP, PLP1.) | syn11725204 | |
| Figure 7 | Fixed cell imaging data to confirm synaptic development (Day 0 – progenitor cells; Day 5 – differentiating cells; and Day 15 – fully differentiated cells. Replicate four-color immunofluorescence images for Hoechst (DNA), NeuN, GAP43 and Syp.) | syn11725204 | |
| Figure 8 | Fixed cell imaging data to investigate maturation of neuronal cytoskeleton (Day 0 – progenitor cells; Day 5 – differentiating cells; and Day 15 – fully differentiated cells. Replicate four-color immunofluorescence images for Hoechst (DNA), MAP1B, MAP2 and DCX.) | syn11725204 | |
| Figure 9 | Fixed cell imaging data to investigate cell fate transitions (Day 0 – progenitor cells; Day 5 – differentiating cells; and Day 15 – fully differentiated cells. Replicate four-color immunofluorescence images for Hoechst (DNA), Ki67, MAPT and TUBB3.) | syn11725204 | |
| Figure 10 | Live cell imaging of drug-treated cells to monitor neurite outgrowth (Kenpaullone, Mevastatin or DMSO-treated cells over 15 days. Four replicates per condition.) | syn11725205 |
Funding Sources
This work was supported by NIH grants R56-AG058063 to MWA and PKS and U54-HL127365 (LINCS) to TJM and PKS.