Project Explorer
Highly multiplexed imaging of single cells using a high-throughput cyclic immunofluorescence method
Jia-Ren Lin1, Mohammad Fallahi-Sichani2, and Peter K. Sorger1
1 HMS LINCS Center, Laboratory of Systems Pharmacology, Harvard Medical School, Boston, MA; 2 Department of Systems Biology, Harvard Medical School, Boston, MA
Nat Commun (2015) 6, Article number: 8390
doi:10.1038/ncomms9390 / PMID:26399630 / PMCID:PMC4587398
Overview
CycIF is a novel, robust and inexpensive method for performing high-dimensionality fluorescence microscopy using standard instrumentation and reagents. We describe three variants of the CycIF protocol that can be applied combinatorially to a single sample to achieve multiple rounds of live-cell fluorescence imaging of reporter-expressing and dye-labeled cells, of direct immunofluorescence imaging using fluor-conjugated antibodies, and of indirect immunofluorescence imaging using secondary antibodies. The rich data collected using CycIF are amenable to state-of-the-art, high-dimensionality analysis tools developed for CyTOF, including ViSNE and Wanderlust, that allow investigation of complex associations and interdependencies between observed features and phenotypes.
Available Data and Resources

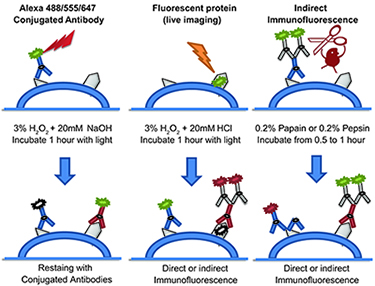
Figure 2. Three different fluorophore-inactivation methods are used in CycIF. Alexa 488/555/647 fluorophores are chemically inactivated using base-catalyzed oxidation. For fluorescent proteins, acid-catalyzed peroxidation is used. Protease-mediated antibody stripping is used following indirect immuno-fluorescence to digest both primary/secondary antibodies.
- Download the CycIF protocol. Date of last update to the protocol (to version 2.0): July 2, 2015. The protocol also was published in Current Protocols in Chemical Biology in December, 2016.
- Provide feedback or ask questions via our Google group.
- Access all of the raw and registered image data, the coordinate data for all regions of interest, and the calculated intensity measurement data and other metrics for each individual well for the representative, 2-cycle CycIF analysis shown below (and in Figure 1b of the paper) through the associated dataset in the HMS LINCS Database (HMS Dataset #20236).
- Download the image processing scripts used to register and analyze these CycIF data.
- Also, view below or download the current table of antibodies and dyes tested by CycIF in the Sorger lab. Antibodies and dyes shown in green work across all cell lines and conditions tested to date, in orange work in specific conditions/cells, as expected for the cell line-specific proteins being analyzed (e.g. EpCAM), and in red have not worked in any cell line or condition tested thus far. Vendor, catalog number, lot number, and dilution information is included. Please note that only the listed lot numbers have been tested, and we cannot comment on the effectiveness of other batches from the same vendor.
Vendor abbreviations: CST = Cell Signaling Technology, AB = Abcam, SC = Santa Cruz Biotechnology, Inc., INV = Invitrogen, BIO = BioLegend.
| Alexa-488/FITC-conjugated | Alexa-555/TRITC/Cy3-conjugated | Alexa-647/Cy5-conjugated |
| p-ERK1/2 T202/Y204 (CST #4344, Lot #12) Dilution: 1:200 |
p-Rb S807/S811 (CST #8957, Lot #1) Dilution: 1:400 |
p21 Waf1/Cip1 (CST #8587, Lot #3) Dilution: 1:200 |
| EGFR (CST #5616, Lot #4) Dilution: 1:400 |
p-Histone H3 S10 (CST #3475, Lot #2) Dilution: 1:800 |
p-S6 S235/S236 (CST #4851, Lot #22) Dilution: 1:400 |
| Lamin A/C (CST #8617, Lot #2) Dilution: 1:400 |
beta-Actin (CST #8046, Lot #1) Dilution: 1:200 |
beta-Tubulin (CST #3624, Lot #4) Dilution: 1:200 |
| p-S6 S240/S244 (CST #5018, Lot #4) Dilution: 1:800 |
VEGFR2 (CST #12872, Lot #1) Dilution: 1:400 |
beta-Catenin (CST #4627, Lot #5) Dilution: 1:400 |
| PCNA (CST #8580, Lot #1) Dilution: 1:400 |
Vimentin (CST #9855, Lot #1) Dilution: 1:200 |
mTOR (CST #5048, Lot #2) Dilution: 1:300 |
| Ki-67 (CST #11882, Lot #4) Dilution: 1:400 |
p-S6 S235/S236 (CST #3985, Lot #4) Dilution: 1:300 |
pan-Akt (CST #5186, Lot #3) Dilution: 1:400 |
| Cyclin D1 (AB #AB190194, Lot #GR199456-1) Dilution: 1:400 |
p-AuroraABC (CST #13464, Lot #1) Dilution: 1:200 |
p65 NFkB (AB #AB190589, Lot #GR199457-1) Dilution: 1:800 |
| Bax (BIO #633603, Lot #B169774) Dilution: 1:400 |
S6 (CST #6989, Lot #2) Dilution: 1:200 |
p27 (AB #AB194234, Lot #GR200274-1) Dilution: 1:400 |
| EpCAM (CST #5198, Lot #9) Dilution: 1:100 |
pan-Keratin (CST #3478, Lot #4) Dilution: 1:200 |
p75 NGF Receptor (AB #AB195180, Lot #GR203573-1) Dilution: 1:400 |
| c-Jun (AB #AB193780, Lot #GR203494-1) Dilution: 1:400 |
p-Histone H2A.X S139 (CST #8228, Lot #3) Dilution: 1:200 |
p-H2.AX S139 (CST #9270, Lot #15) Dilution: 1:400 |
| E-Cadherin (CST #3199, Lot #11) Dilution: 1:200 |
LC3A/B (CST #13173, Lot #1) Dilution: 1:200 |
Vimentin (CST #9856, Lot #7) Dilution: 1:800 |
| p-c-Jun (CST #12714, Lot #6) |
ActinRed 555 (INV #R371112, Lot #1646656) |
CD45 (BIO #304020, Lot #B1810139) Dilution: 1:400 |
| p-CREB (CST #9187, Lot #6) |
cPARP (CST #6894, Lot #1) Dilution: 1:200 |
p-H2.AX S139 (BIO #613407, Lot #B199199) Dilution: 1:400 |
| p-HSP27 (CST #12172, Lot #1) |
p21 Waf1/Cip1 (CST #8493, Lot #2) Dilution: 1:200 |
p-Tyrosine (CST #9415, Lot #8) Dilution: 1:100 |
| Cyclin B1 (SC #SC-752, Lot #K1008) |
Sox2 (CST #5179, Lot #4) |
Her2 (BIO #324412, Lot #B179768) Dilution: 1:200 |
| cdc2/CDK1 (SC #SC-54, Lot #G0606) |
Oct-4A (CST #4439, Lot #1) |
FOXO3a (AB #AB196539, Lot #GR20247-1) |
| cMyc (SC #SC-40, Lot #B2813) |
Bcl-2 (BIO #658705, Lot #B180139) |
Date of last update to the antibody table: July 7, 2015.
Representative CycIF Results and Analysis
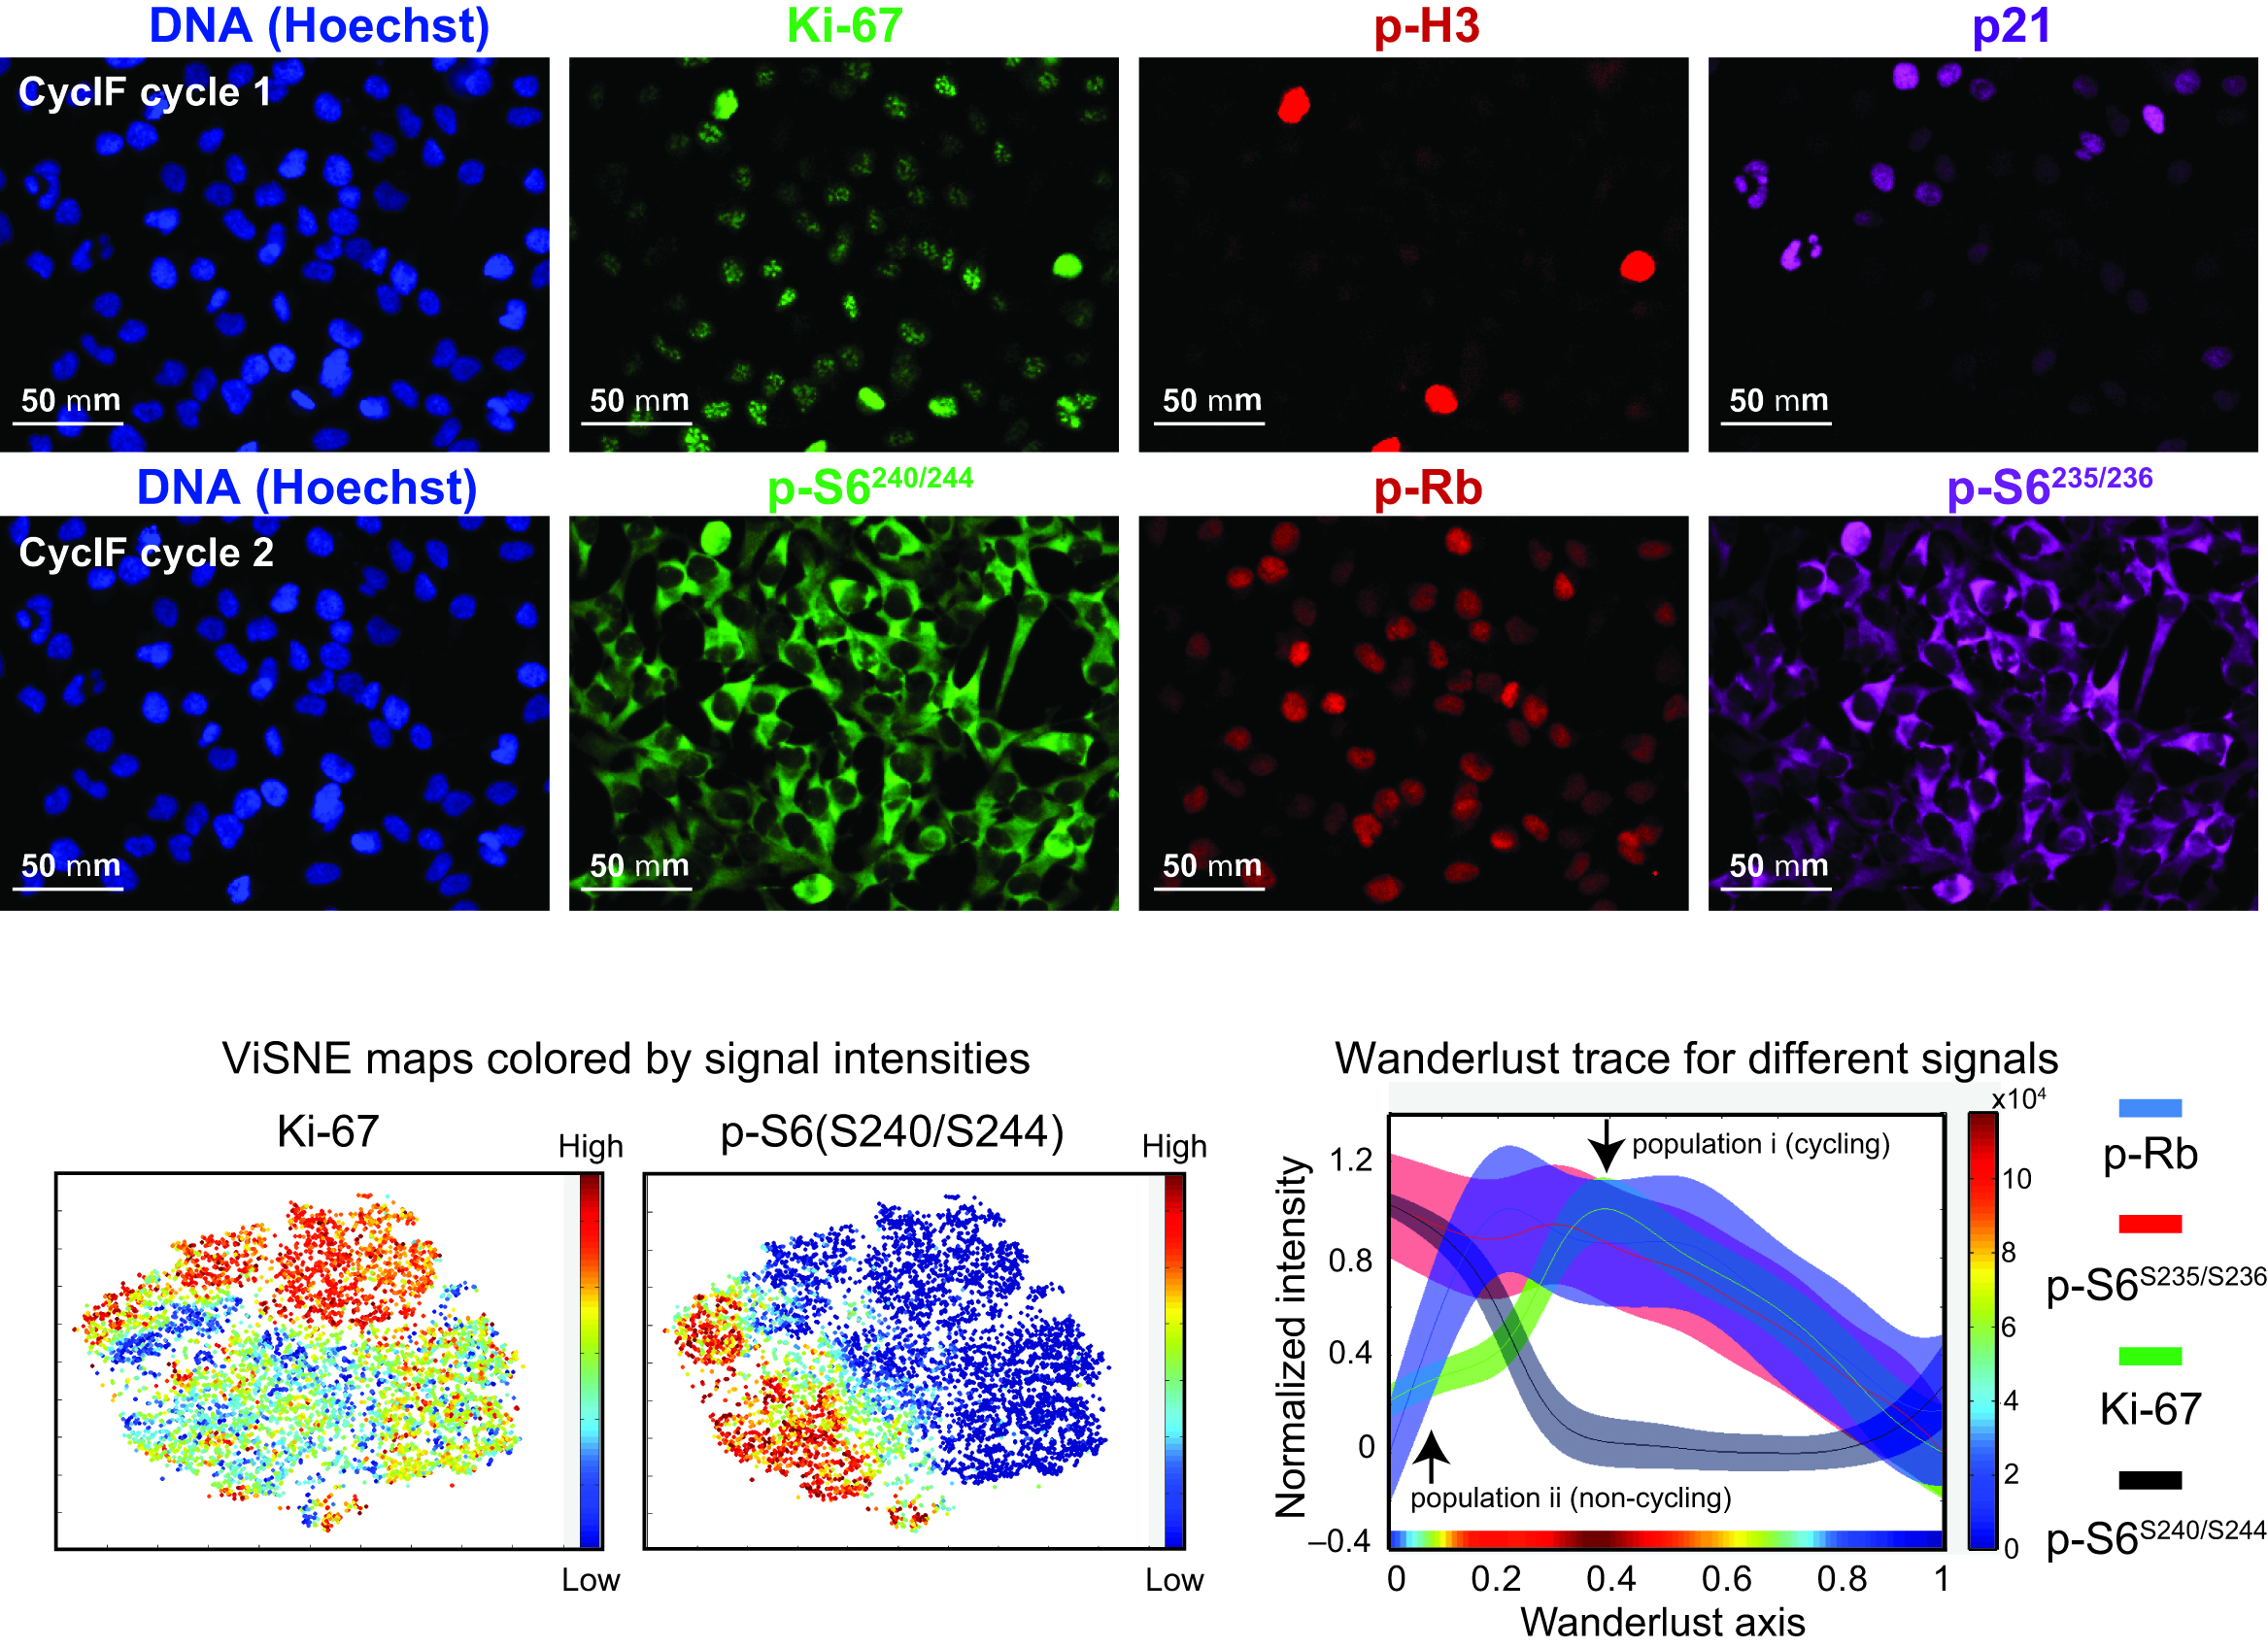
For more details, please see Figures 1b and 3 in the associated paper and the associated dataset in the HMS LINCS Database.

Figure 3. Upper panel: Eight images obtained during two rounds of CycIF on COLO 858 cells treated with different doses of Vemurafenib for 48 hrs. Lower panel: High-dimensional analyses of CycIF data using viSNE and Wanderlust. Two-dimensional projections of Ki-67 and pS6S240/244 signal intensities from single-cell CycIF data (left two panels) were plotted and colored according to the intensity scales shown to the right of each panel. Wanderlust traces (right panel) show the observed signal intensities for p-RbS807/811, pS6S235/236, Ki-67, and pS6S240/244 across a five-point (0-1 μM) vemurafenib dose-response dataset. The colored stripe at the bottom of the panel depicts cell density according to the colored scale shown to the right of the panel.
Related References
1. Lin, J.R., Fallahi-Sichani, M., Chen, J.Y., and Sorger, P.K. (2016) Cyclic Immunofluorescence (CycIF), a highly multiplexed method for single-cell imaging. Curr Protoc Chem Biol. 8(4):251-264. doi:10.1002/cpch.14 PMID:27925668 PMCID:PMC5233430